Apple Health Data Lake in AWS – Odds and Ends
In my previous blog post I described the process of using my Apple Health (AH) records collected over the course of many years and migrating it to a data lake. I omitted some details which I will address here. I may write another post later if I deem it worthwhile.
Data completeness
The earlier post only dealt with architecture and daily incremental ingest. However by itself it is almost useless to me as an end user. The real power of analytics comes with combining the most recent data with records collected years ago to make meaningful comparisons.
People with project ideas like this do not usually think to do it immediately after they start recording data with the device. They typically have years worth of data. In my case data goes back to 2020 and meaningful daily health metrics to late 2021. The introduction of the Apple Watch Ultra was a game changer personally because on many occasions I noticed that I was constrained by the battery life in terms of how long I could continue wearing the watch the longer into the day I was and what activities I could record. Certain activities like gran fondos and all day hikes were also out of reach.
There is hence a need for some type of backfill. Getting old data into this data lake sounds trivial and is easy to conceptually imagine but requires a deceptively large amount of decision making and value judgment. Some of those decisions will be gone over in more detail later on in the post.
HAE issues
This process and journey proved to be a lot more difficult than I would have hoped because unfortunately the data from the Health Auto Export app (HAE) is not suitable to get historical backfills into my data lake.
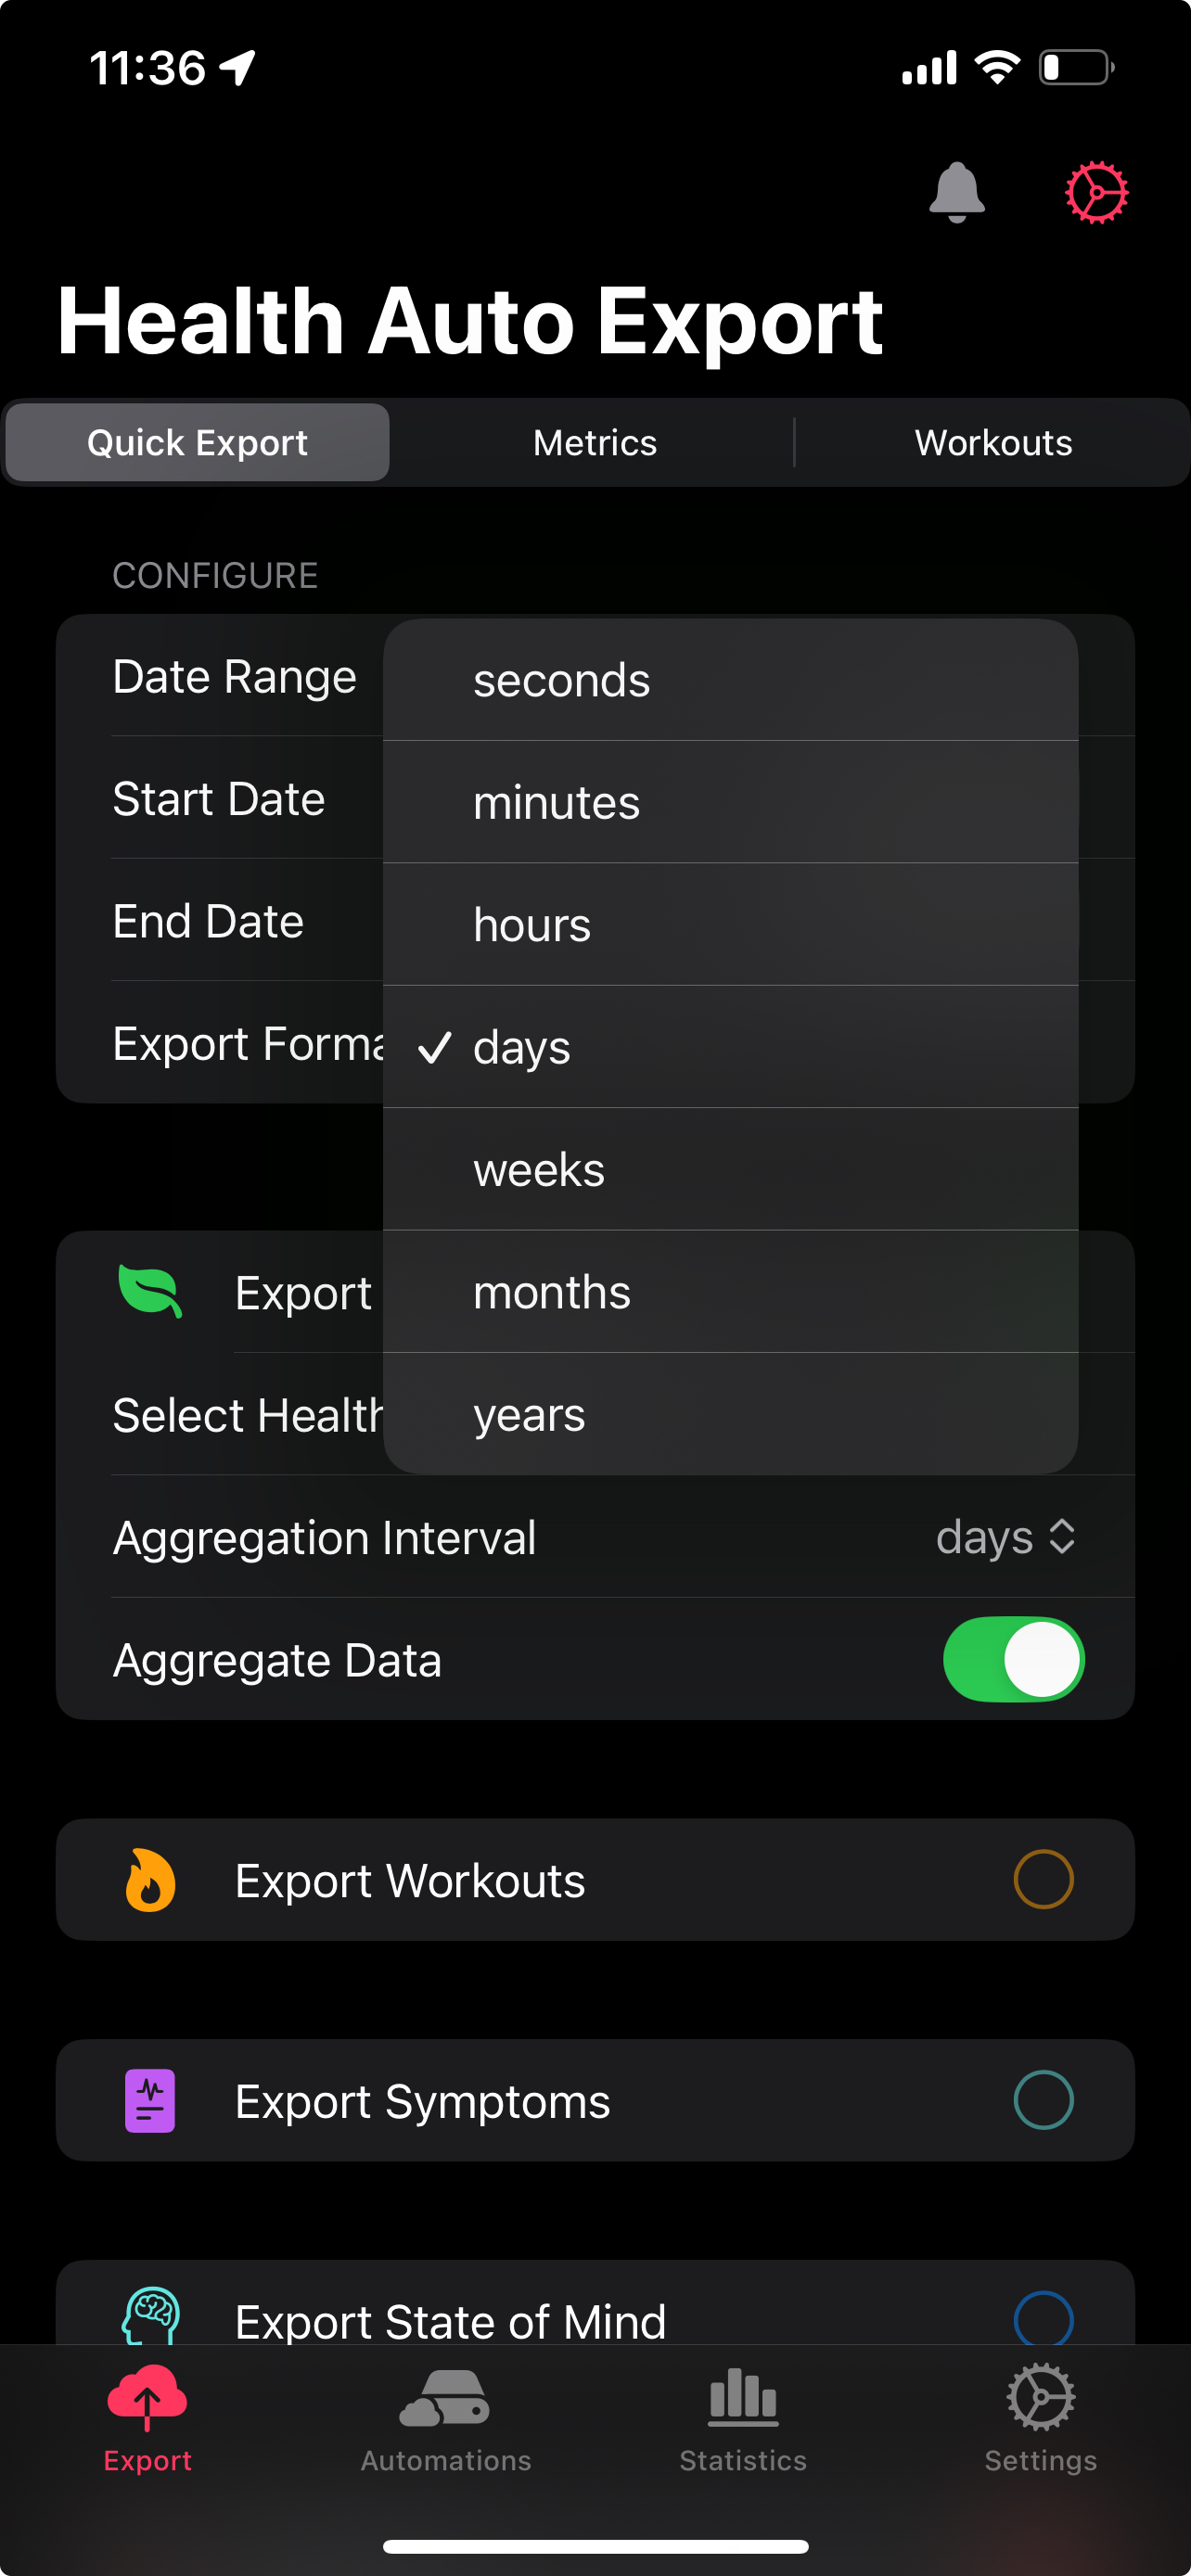 Manual export options
The option is there to get data at the precision level of seconds which is the same level of granularity with which it is held raw in AH. However when I downloaded the data and had a look I saw that it cannot be used at all for my intended purpose.
To illustrate why I have a bar chart of a day of potential backfill data. This is not a histogram but instead thousands of observations of the same quantity but with otherwise normal looking date columns and data field name variety.
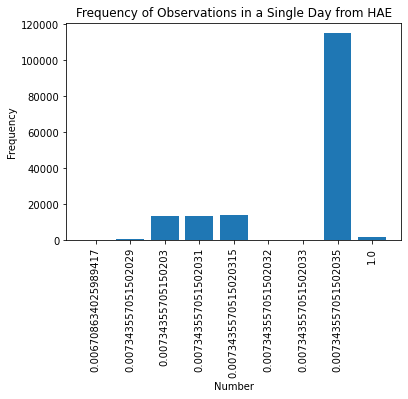 I cannot backfill my data lake when the data coming from HAE looks like this
In my own testing I found that this mistake corrects itself when you choose the day level of precision from HAE. For example in the case of a daily observation like resting heart rate it makes no difference if you download data from AH or HAE.
Time granularity
AH collects series of over 100 metrics and puts it in a convenient central place. For many data series like body mass having only the date of the observation is enough to draw meaningful analytics. This also applies for what I consider to be the majority of other metrics stored by AH. It is also the case that collecting timestamp data vastly increases cloud costs in terms of data storage and glue processing. However it is possible for me to think of instances where the hour, the minute and even the second of the observation matters. One instance is if I am doing a HIIT workout where heart rate rapidly rises and falls and by the minute will not be granular enough because some HIIT workouts are over in five minutes or so. With vast amounts of timestamp information I can also answer questions like “am I more likely to stand up as the coming hour approaches for a break?”. Part of the aim of this project is I want to challenge myself to manage data infrastructure with close to ten million observations so I am not put off by the fact that timestamp information processing makes this harder than it otherwise needs to be.
Another motivation I had was it allowed me to make use of the Julia package I wrote earlier to process this type of large xml file and not feel like I wasted my time.
AH/HAE merging
One benefit of the fact that daily observations are equivalent between AH and HAE is that it allows me to settle something that vexed me when all I had was AH data. When there are multiple observations on the same day it can be tricky to tell if they are meant to be added together cumulatively to get an overall metric for the day or whether they are independent snapshots. In some instances it is clear. For example you do not add two resting heart rates together to get a resting heart rate for the day but for many of the arcane metrics it is not clear at all until I undertook this analysis.
Knowing what I am dealing with now becomes crucial later on when it comes to making dashboards using QuickSight. Most of my charts are time series with dates on the x axis. If the data is snapshot I need to ensure when formatting the data on the visual to choose the mean or average rather than the sum in order to draw the correct insights.
Reconciling the two data sources so they are seamless in the data lake requires some thinking and preparation. Because the data coming in from the API is automatic I have to mould my AH data to be like my HAE data before I upload it to my data lake.
The structure from HAE felt like a breakthrough in my understanding because I was having difficulty trying to manage eight or more fields for each observation much of them containing fields that are not relevant at all for end user analytics. After seeing what HAE includes it felt obvious what four fields really matter. Here is an example of an element in the AH XML file.
<Record type="HKQuantityTypeIdentifierDietaryWater" sourceName="Cronometer" sourceVersion="2009" device="<<HKDevice: 0x303e2f520>, name:iPhone, manufacturer:Apple, model:iPhone, software:17.5.1, UDIDeviceIdentifier:3BA9429E-E475-4D8D-9AD0-6A5D221C9D2F>" unit="mL" creationDate="2024-08-09 13:49:55 +1200" startDate="2024-08-07 12:58:00 +1200" endDate="2024-08-07 12:58:00 +1200" value="371.117"/>
The tag gets converted to the name field after being simplified. The unit and value fields remain unchanged. There are three timestamp fields to pick from.
That means the only thing left is exhaustively going through every single metric in HAE and AH using Table 1 to ensure they reconcile.
Backfill strategy
A helpful list is provided by the developer of HAE here. There is a large amount to choose from and it is exhausting to have to go through them one by one. Some I have not included in Table 1 because they do not apply to my circumstances. Some others may apply to my circumstances in the future but not now. Anything that requires manual user input to AH I am omitting. This is meant to be automation of sensor data from my IOT devices.
From a data quality perspective having lots of snapshot metrics makes life a lot easier because if there are multiple observations a day only one needs to be sent via the REST API for the data in the data lake to be accurate. However in my experience I have noticed that some of the metrics that rely on aggregation can be quite far off between AH and HAE and therefore are not carried through. If the data is within the ballpark of each other that indicates that the data can be seen as referring to the same metrics but it becomes useless to draw trends because you do not know if it is caused by the data generating process or something external.
Table 1 was constructed from me getting a days worth of data from HAE for each row representing a metric. That is compared against the data from filtering what I download in AH for that specific day. It is possible for me to accept later on a metric if further checks reveal that they line up more often than they diverge. However this is unlikely. It is important for me to draw insights and if there is too much inherent divergence between the two sources that no longer becomes possible.
Many of these metrics I may never look at which is annoying to think about because it takes a lot of work to go to the effort to classify it. However like I said earlier that might change and a goal of this project is managing close to ten million individual observations so I am making a design decision to err on the side of being more inclusive.
Table. Table 1: Data Mapping
| HAE field |
AH XML file tag |
Snapshot/Aggregate/Daily |
Accept/Discard |
Comments |
| active_energy |
HKQuantityTypeIdentifierActiveEnergyBurned |
Aggregate |
✘ |
The discrepancy is too high between the two numbers. |
| apple_exercise_time |
HKQuantityTypeIdentifierAppleExerciseTime |
Aggregate |
✔ |
|
| apple_stand_hour |
HKCategoryTypeIdentifierAppleStandHour |
✘ |
✘ |
Takes a string value of either HKCategoryValueAppleStandHourStood or HKCategoryValueAppleStandHourIdle in the XML file which is not a suitable data type although it can be converted to an integer the data then needs to be decoded |
| apple_stand_time |
HKQuantityTypeIdentifierAppleStandTime |
Aggregate |
✔ |
|
| basal_energy_burned |
HKQuantityTypeIdentifierBasalEnergyBurned |
Aggregate |
✘ |
The discrepancy is too high between the two numbers |
| cycling_distance |
HKQuantityTypeIdentifierDistanceCycling |
Aggregate |
✘ |
The number taken directly from Apple is unreliable so there is no point checking if it reconciles with the exporter app |
| flights_climbed |
HKQuantityTypeIdentifierFlightsClimbed |
Aggregate |
✔ |
|
| physical_effort |
HKQuantityTypeIdentifierPhysicalEffort |
Snapshot |
✔ |
|
| running_power |
HKQuantityTypeIdentifierRunningPower |
Snapshot |
✔ |
|
| running_speed |
HKQuantityTypeIdentifierRunningSpeed |
Snapshot |
✔ |
|
| step_count |
HKQuantityTypeIdentifierStepCount |
Aggregate |
✘ |
The discrepancy is too high between the two numbers |
| vo2_max |
HKQuantityTypeIdentifierVO2Max |
Snapshot |
✔ |
|
| walking_running_distance |
HKQuantityTypeIdentifierDistanceWalkingRunning |
Aggregate |
✘ |
The discrepancy is too high between the two numbers. |
| environmental_audio_exposure |
HKQuantityTypeIdentifierEnvironmentalAudioExposure |
Snapshot |
✔ |
|
| headphone_audio_exposure |
HKQuantityTypeIdentifierHeadphoneAudioExposure |
Snapshot |
✔ |
|
| cardio_recovery |
✘ |
✘ |
✘ |
There are many similarly named metrics in Apple Health but none map obviously to this |
| heart_rate |
✘ |
✘ |
✘ |
This does not match a record tag in Apple Health but there is heart rate metadata attached to the heart rate variability record whenever it is recorded |
| heart_rate_variability |
HKQuantityTypeIdentifierHeartRateVariabilitySDNN |
Snapshot |
✔ |
|
| resting_heart_rate |
HKQuantityTypeIdentifierRestingHeartRate |
Snapshot |
✔ |
|
| walking_heart_rate_average |
HKQuantityTypeIdentifierWalkingHeartRateAverage |
Daily |
✔ |
This is a metric that almost always is collected once per day. On the rare day when multiple are collected the app prefers the earlier observation in the day |
| running_ground_contact_time |
HKQuantityTypeIdentifierRunningGroundContactTime |
Snapshot |
✔ |
|
| running_stride_length |
HKQuantityTypeIdentifierRunningStrideLength |
Snapshot |
✔ |
|
| running_vertical_oscillation |
HKQuantityTypeIdentifierRunningVerticalOscillation |
Snapshot |
✔ |
|
| six_minute_walking_test_distance |
✘ |
✘ |
✘ |
This data appears to be only of use internally as a check because it does not have anything valuable for the end user |
| stair_speed_up |
HKQuantityTypeIdentifierStairAscentSpeed |
Snapshot |
✔ |
|
| stair_speed_down |
HKQuantityTypeIdentifierStairDescentSpeed |
Snapshot |
✔ |
|
| walking_speed |
HKQuantityTypeIdentifierWalkingSpeed |
Snapshot |
✔ |
|
| walking_step_length |
HKQuantityTypeIdentifierWalkingStepLength |
Snapshot |
✔ |
|
| walking_asymmetry_percentage |
HKQuantityTypeIdentifierWalkingAsymmetryPercentage |
Snapshot |
✔ |
|
| walking_double_support_percentage |
HKQuantityTypeIdentifierWalkingDoubleSupportPercentage |
Aggregate |
✔ |
The numbers reconcile between the two sources however it is expressed as a decimal in Apple Health and a whole number of percentage from exporter app |
| blood_oxygen_saturation |
HKQuantityTypeIdentifierOxygenSaturation |
Snapshot |
✔ |
|
| body_mass |
HKQuantityTypeIdentifierBodyMass |
✘ |
✘ |
Despite existing in Apple Health records it does not export from exporter app records |
| body_mass_index |
HKQuantityTypeIdentifierBodyMassIndex |
Snapshot |
✔ |
|
| lean_body_mass |
HKQuantityTypeIdentifierLeanBodyMass |
Snapshot |
✔ |
|
| carbohydrates |
HKQuantityTypeIdentifierDietaryCarbohydrates |
Aggregate |
✔ |
|
| dietary_energy |
HKQuantityTypeIdentifierDietaryEnergyConsumed |
Aggregate |
✔ |
|
| dietary_sugar |
HKQuantityTypeIdentifierDietarySugar |
Aggregate |
✔ |
|
| dietary_water |
HKQuantityTypeIdentifierDietaryWater |
Aggregate |
✔ |
|
| dietary_biotin |
HKQuantityTypeIdentifierDietaryBiotin |
✘ |
✘ |
I am unable to find this metric in HAE but it is available in AH |
| dietary_caffeine |
HKQuantityTypeIdentifierDietaryCaffeine |
Aggregate |
✔ |
|
| calcium |
HKQuantityTypeIdentifierDietaryCalcium |
Aggregate |
✔ |
|
| chromium |
HKQuantityTypeIdentifierDietaryChromium |
Aggregate |
✔ |
|
| copper |
HKQuantityTypeIdentifierDietaryCopper |
Aggregate |
✔ |
|
| fiber |
HKQuantityTypeIdentifierDietaryFiber |
Aggregate |
✔ |
|
| folate |
HKQuantityTypeIdentifierDietaryFolate |
Aggregate |
✔ |
|
| iodine |
HKQuantityTypeIdentifierDietaryIodine |
Aggregate |
✔ |
|
| iron |
HKQuantityTypeIdentifierDietaryIron |
Aggregate |
✔ |
|
| magnesium |
HKQuantityTypeIdentifierDietaryMagnesium |
Aggregate |
✔ |
|
| manganese |
HKQuantityTypeIdentifierDietaryManganese |
Aggregate |
✔ |
|
| molybdenum |
HKQuantityTypeIdentifierDietaryMolybdenum |
Aggregate |
✔ |
|
| monounsaturated_fat |
HKQuantityTypeIdentifierDietaryFatMonounsaturated |
Aggregate |
✔ |
|
| niacin |
HKQuantityTypeIdentifierDietaryNiacin |
Aggregate |
✔ |
|
| pantothenic_acid |
HKQuantityTypeIdentifierDietaryPantothenicAcid |
Aggregate |
✔ |
|
| polyunsaturated_fat |
HKQuantityTypeIdentifierDietaryFatPolyunsaturated |
Aggregate |
✔ |
|
| potassium |
HKQuantityTypeIdentifierDietaryPotassium |
Aggregate |
✔ |
|
| protein |
HKQuantityTypeIdentifierDietaryProtein |
Aggregate |
✔ |
|
| riboflavin |
HKQuantityTypeIdentifierDietaryRiboflavin |
Aggregate |
✔ |
|
| saturated_fat |
HKQuantityTypeIdentifierDietaryFatSaturated |
Aggregate |
✔ |
|
| selenium |
HKQuantityTypeIdentifierDietarySelenium |
Aggregate |
✔ |
|
| sodium |
HKQuantityTypeIdentifierDietarySodium |
Aggregate |
✔ |
|
| thiamin |
HKQuantityTypeIdentifierDietaryThiamin |
Aggregate |
✔ |
|
| total_fat |
HKQuantityTypeIdentifierDietaryFatTotal |
Aggregate |
✔ |
|
| vitamin_a |
HKQuantityTypeIdentifierDietaryVitaminA |
Aggregate |
✔ |
|
| vitamin_b6 |
HKQuantityTypeIdentifierDietaryVitaminB6 |
Aggregate |
✔ |
|
| vitamin_b12 |
HKQuantityTypeIdentifierDietaryVitaminB12 |
Aggregate |
✔ |
|
| vitamin_c |
HKQuantityTypeIdentifierDietaryVitaminC |
Aggregate |
✔ |
|
| vitamin_d |
HKQuantityTypeIdentifierDietaryVitaminD |
Aggregate |
✔ |
|
| vitamin_e |
HKQuantityTypeIdentifierDietaryVitaminE |
Aggregate |
✔ |
|
| vitamin_k |
HKQuantityTypeIdentifierDietaryVitaminK |
Aggregate |
✔ |
|
| zinc |
HKQuantityTypeIdentifierDietaryZinc |
Aggregate |
✔ |
|
| sleep_analysis |
HKCategoryTypeIdentifierSleepAnalysis |
✘ |
✘ |
In Apple Health records the value field which I am strictly typing as floating point integers is typed as a string so I cannot use this data |
| time_in_daylight |
HKQuantityTypeIdentifierTimeInDaylight |
Aggregate |
✔ |
|
| toothbrushing |
HKCategoryTypeIdentifierToothbrushingEvent |
✘ |
✘ |
Takes a string value of HKCategoryValueNotApplicable although perhaps the timestamps along might be of some interest |
Something else I neglected in my earlier post is that it is not enough to get JSON data into the data lake. It needs to be transformed into parquet file format. What I failed to understand is that it is not just that parquet is more efficient when it comes to running SQL queries in Athena but that the Glue crawler does not automatically know the date field is a timestamp and instead classifies it to be string values in the semi-structured JSON file. It also classifies quantitative data that only consists of digits as also potentially being string values meaning that you need to resolve the choice between the two in the ETL transformation. The latter task cannot be done as part of a visual glue job hence the need to write code in PySpark which I am including as a snippet. It is helpful for dashboarding purposes to convert the timestamp into both a timestamp field in the transformed data as well as date. Date types make more sense for charts that involve time series comprising multiple years.
import sys
from awsglue.transforms import *
from awsglue.utils import getResolvedOptions
from PySpark.context import SparkContext
from awsglue.context import GlueContext
from awsglue.job import Job

sc = SparkContext.getOrCreate()
glueContext = GlueContext(sc)
spark = glueContext.spark_session
job = Job(glueContext)
raw_dyf1 = glueContext.create_dynamic_frame.from_catalog(
    database = "database",
    table_name = "table")
raw_dyf1.printSchema()
df1 = raw_dyf1.resolveChoice(specs = [("qty","cast:double"),
                                     ("Max", "cast:double"),
                                     ("Min", "cast:double"),
                                     ("Avg", "cast:double")])
df1.printSchema()
m2 = [("date", "string", "dt", "date"),
      ("date", "string", "date", "timestamp"),
      ("qty", "double", "qty", "double"),
      ("name", "string", "name", "string"),
      ("units", "string", "units", "string"),
      ("source", "string", "source", "string"),
      ("Max", "double", "Max", "double"),
      ("Min", "double", "Min", "double"),
      ("Avg", "double", "Avg", "double"),
      ("inBedStart", "string", "inBedStart", "string"),
      ("asleep", "int", "asleep", "int"),
      ("rem", "double", "rem", "double"),
      ("deep", "double", "deep", "double"),
      ("inBed", "double", "inBed", "double"),
      ("core", "double", "core", "double"),
      ("sleepStart", "string", "sleepStart", "string"),
      ("sleepEnd", "string", "sleepEnd", "string"),
      ("inBedEnd", "string", "inBedEnd", "string"),
      ("awake", "int", "awake", "int")
     ]
df2 = df1.apply_mapping(m2,transformation_ctx = "map")
df2.printSchema()
write_S3_parquet = glueContext.getSink(
    path="s3://",
    connection_type="s3",
    updateBehaviour="UPDATE_✔_DATABASE",
    partitionKeys=["dt"],
    compression="gzip",
    enableUpdateCatalog=True,
    transformation_ctx="write_S3_parquet",
)
write_S3_parquet.setCatalogInfo(
    catalogDatabase="database", catalogTableName="table"
)
write_S3_parquet.setFormat("glueparquet")
write_S3_parquet.writeFrame(df2)
job.commit()
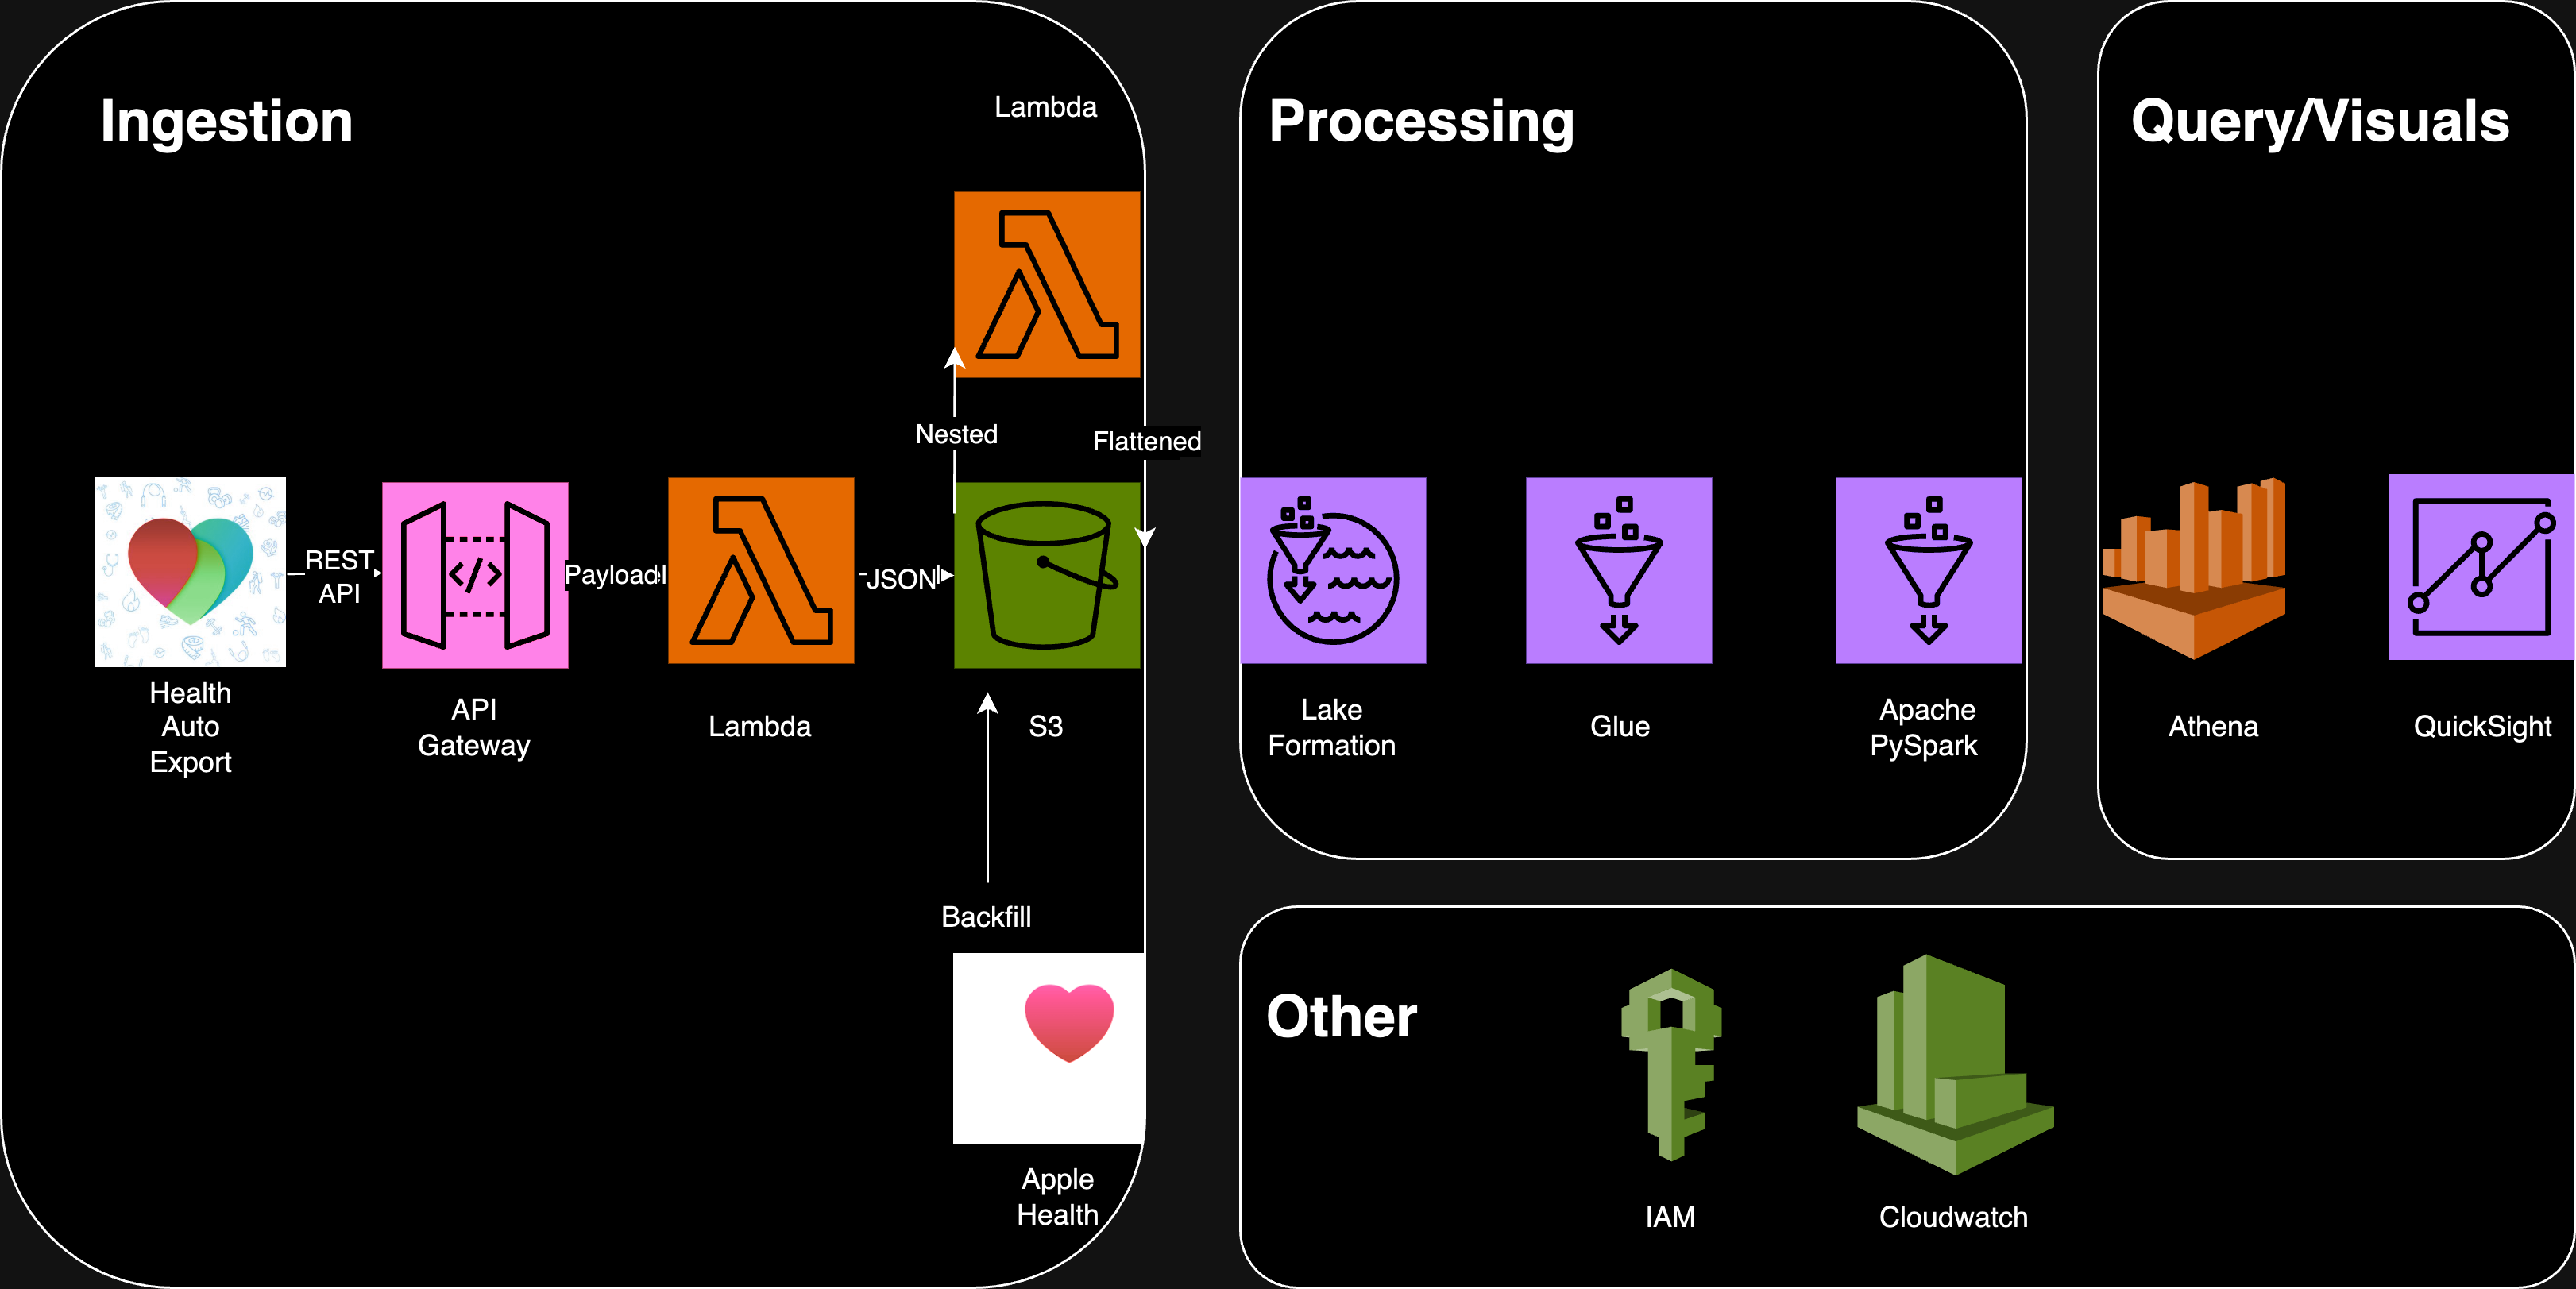
Updated DAG
The changes so far described above change the DAG in the earlier post to something that now looks like this. Given that two sources are used the need to partition at source becomes a necessity. That way periodic one time uploads of AH data can override HAE if it is incomplete or if there are errors
 AWS Services
Workout data
Some workout data is embedded in the list of Records fields which makes this a moot point. The more deeper problem that I am currently procrastinating to avoid is how to include it in the lake for query and dashboarding. A single workout metric doesn’t make sense without context in the same way a generic Records metric can be made sense of just from the quantity and time of observation. Instead workout data has the context of being nested within the workout. For example your heart rate might be low in a workout data record but that might be because you are in a cool down period after doing intervals or because you are fitter than you were years ago.
HAE experiences
Since there don’t appear to be reviews or testimonials about using HAE to export data I will embed a review within this post. One thing worth bringing up is that there are many metrics listed on the health exporter site as being available for download into the REST API. In practice that is misleading. The type of database I am using is HIVE style which requires all the data being the same type. The issue is that the data all basically needs to be numeric. Some of the data upon inspection in my export.xml file is not numeric but a string that alludes to a cardinal value. This is a no go when it comes to putting together data for Athena query or Quicksight. Things might be different if you were to use a database system that allows for mixed type like mongodb.
The issue mentioned earlier of vast amounts of the same low value approaching zero persists also in my daily REST API uploads as well but it is not deterministic like it is when it comes to backfilling historical records. This is an area I am still investigating and troubleshooting and may update later. Another problem is that I do not have complete confidence that the data doesn’t have holes for the REST API uploads. It frequently does but when there are over 100 metrics to keep track of this seems forgivable especially considering Apple is not very friendly to develop for in applications such as this.
Despite what I mentioned above the developer is incredibly responsive online through Discord so this might be resolved at some point in the future. I am just writing this post with how the situation looks like to me now.
Conclusion
Once the transformed parquet data is imported into QuickSight it becomes possible to get line charts by filtering based on the column containing the name of the metric. For the chart below I have a gap of a few months when I was without an Apple Watch. From August 2022 to May 2023 my walking heart rate average trended lower as I gained fitness.
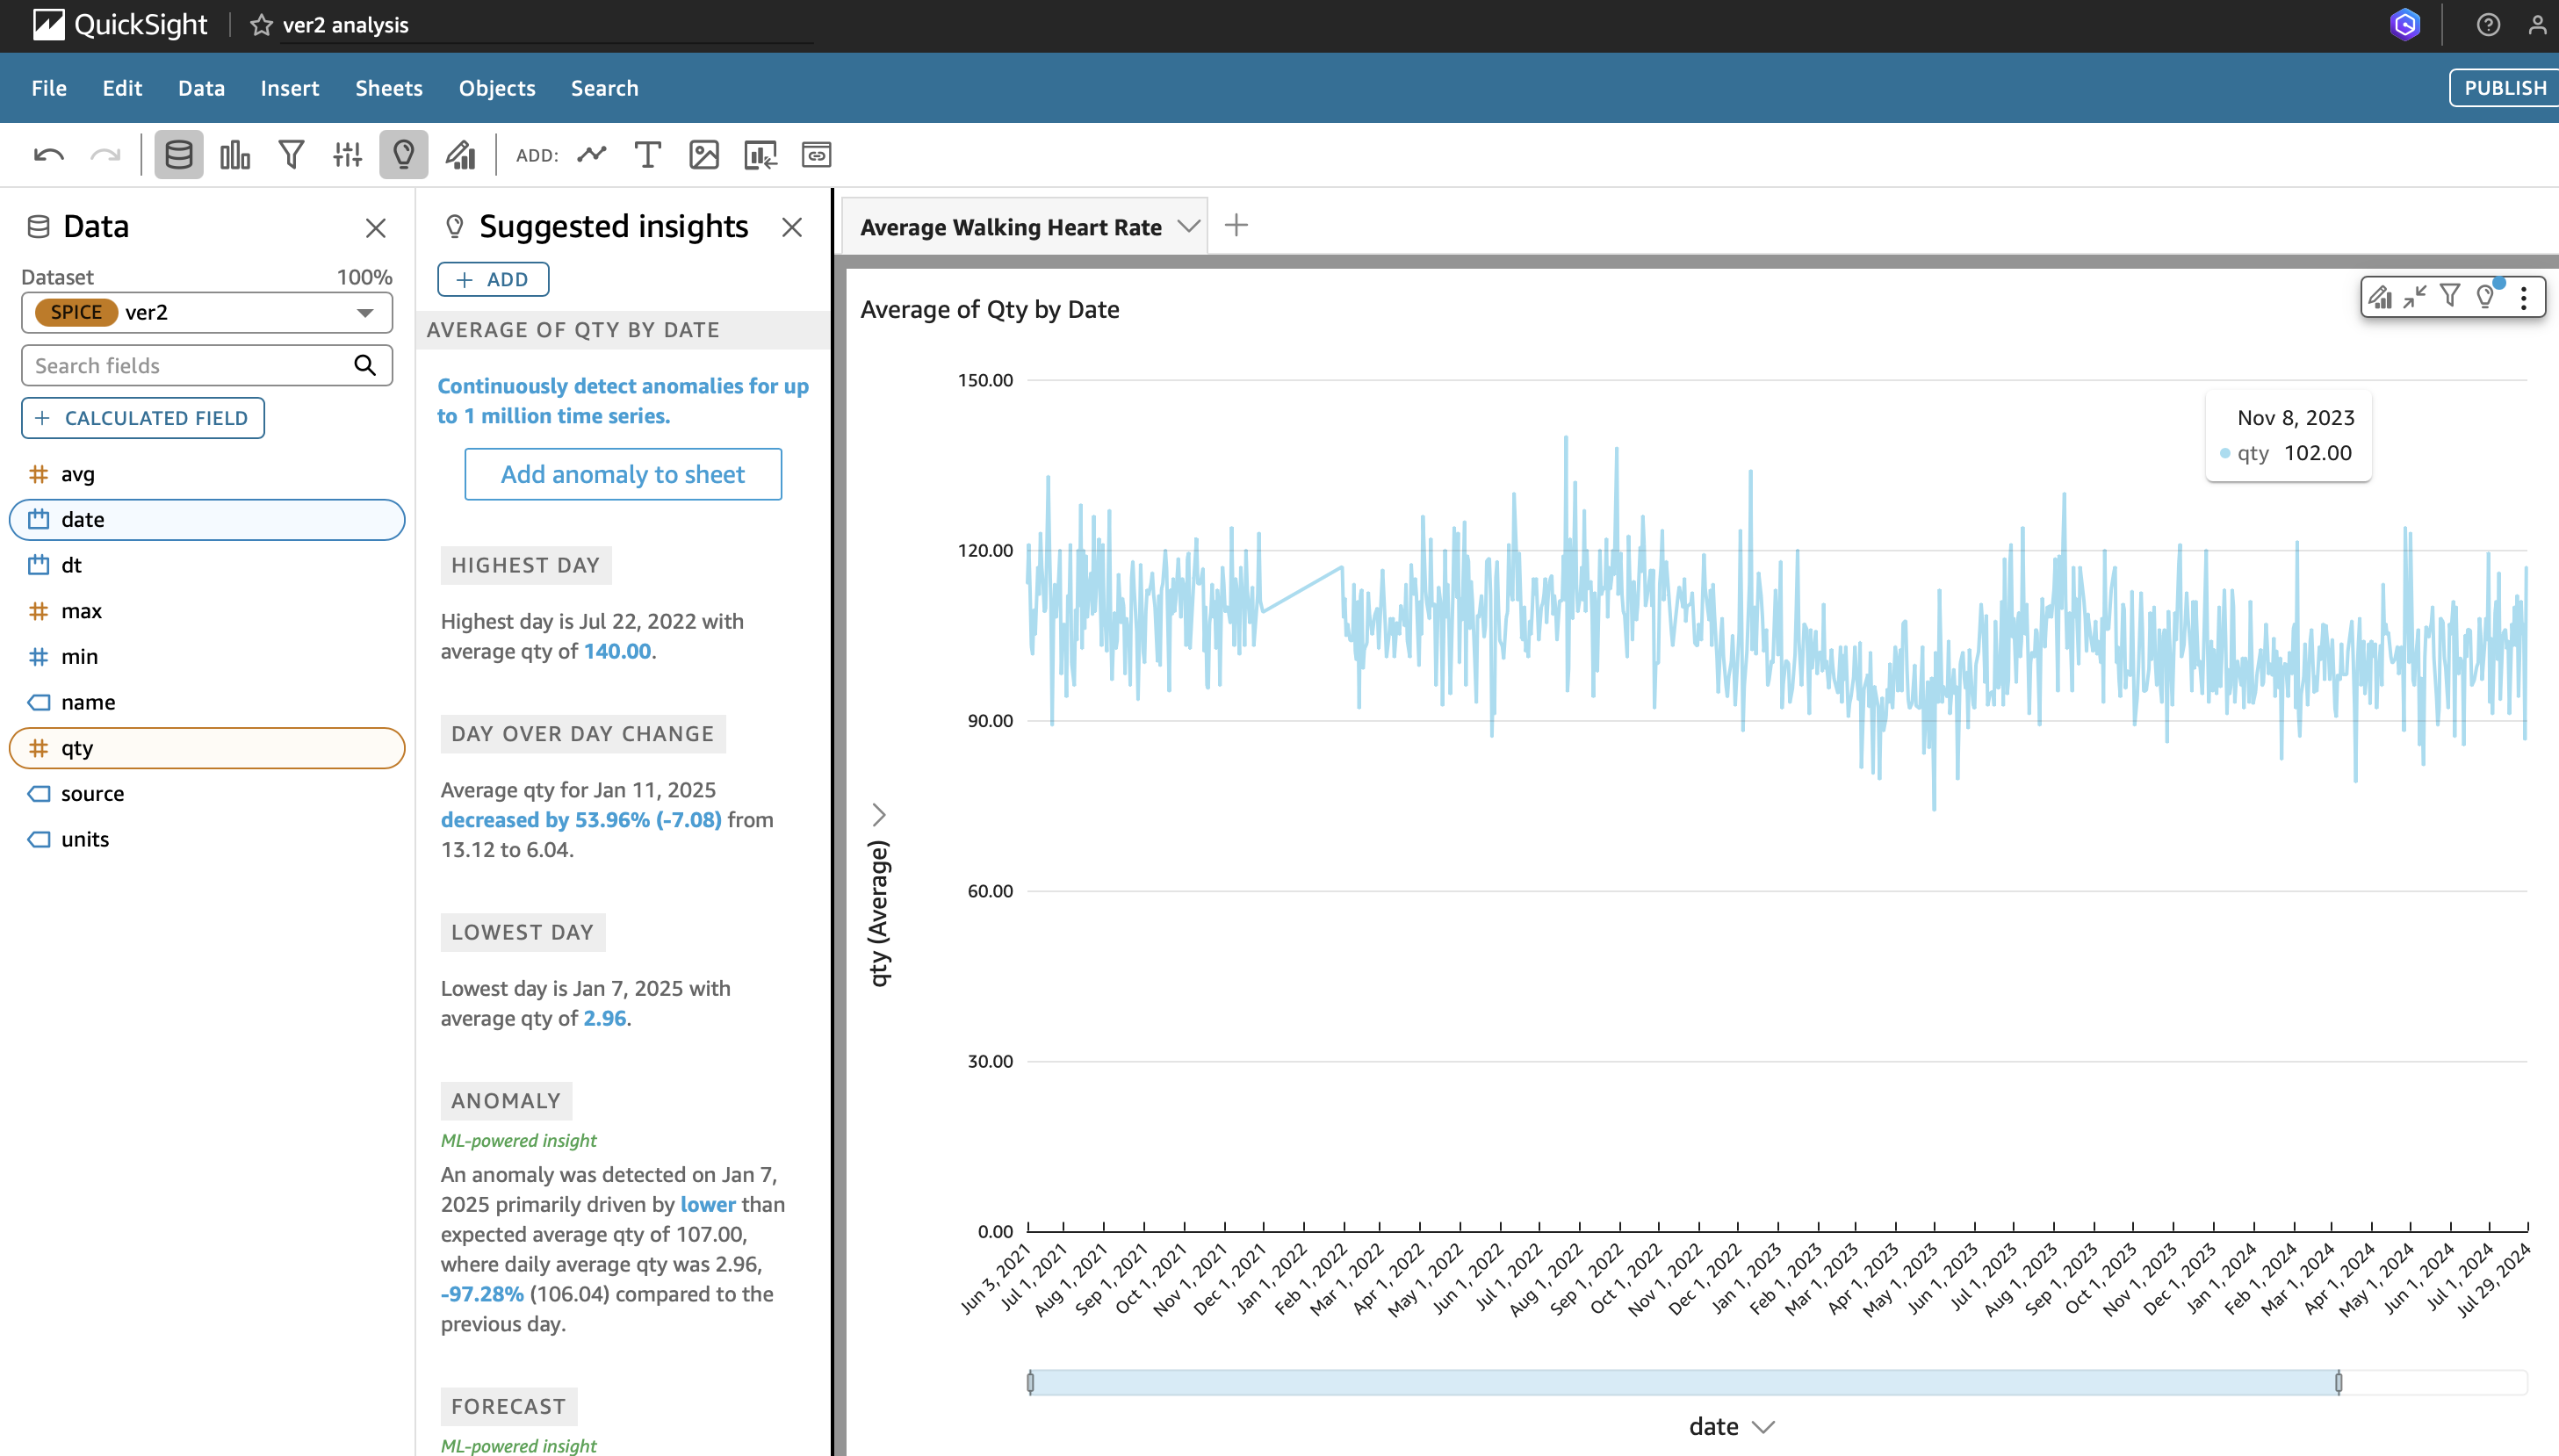 Average Walking Heart Rate